The Population Projections for Middlesex County 2021–2046 includes three growth scenarios (Low, Reference, and High) for the County and each local municipality. Endorsed by Council on January 19, 2021, these projections are intended to be used by the County and local municipalities to assist in managing growth and development over a 25-year planning horizon.
Population projections are based on past population statistics and assumptions which can be significantly impacted by external factors such as declining birth rates, changes in migration patterns, the aging of the population, changes in life expectancy, and differences in commuting patterns. The range of growth scenarios allows municipalities to select the forecast that is most appropriate for their local circumstances
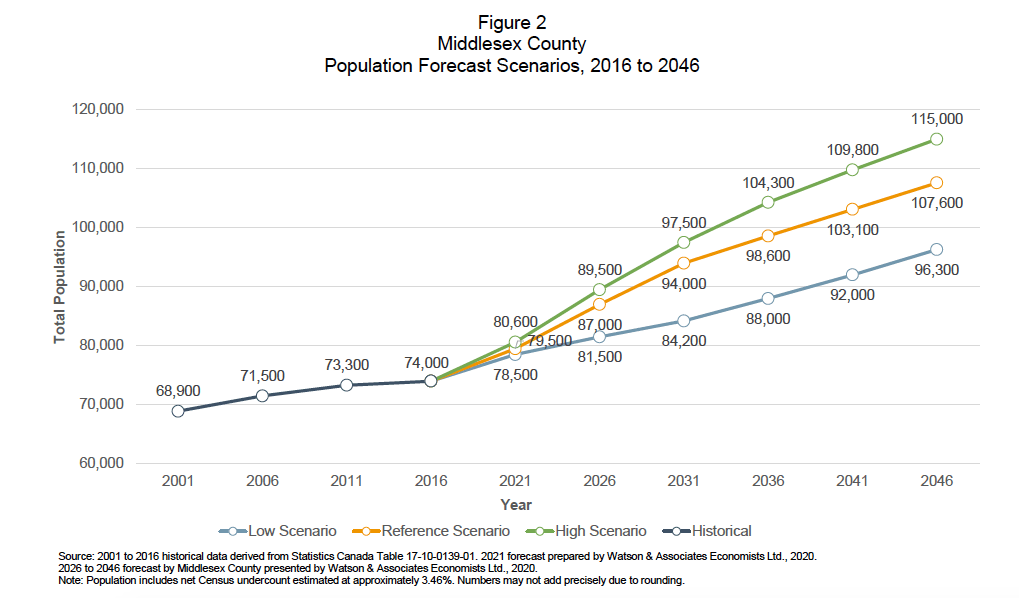
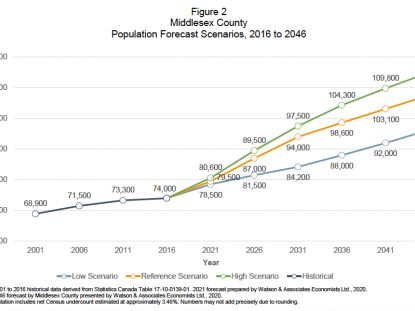
- Under the Low Scenario the County’s population is forecast to increase from 74,000 in 2016 to 96,300 in 2046, which represents an annual population growth rate of 0.9%. This would result in a housing growth rate of 1.3% annually.
- Under the Reference Scenario, the County’s population is forecast to increase to 107,600 by 2046, representing an annual growth rate of 1.3%. This would result in a housing growth rate of 1.7% annually.
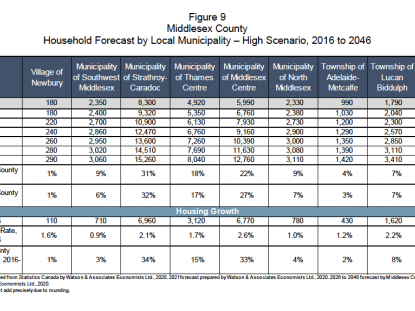
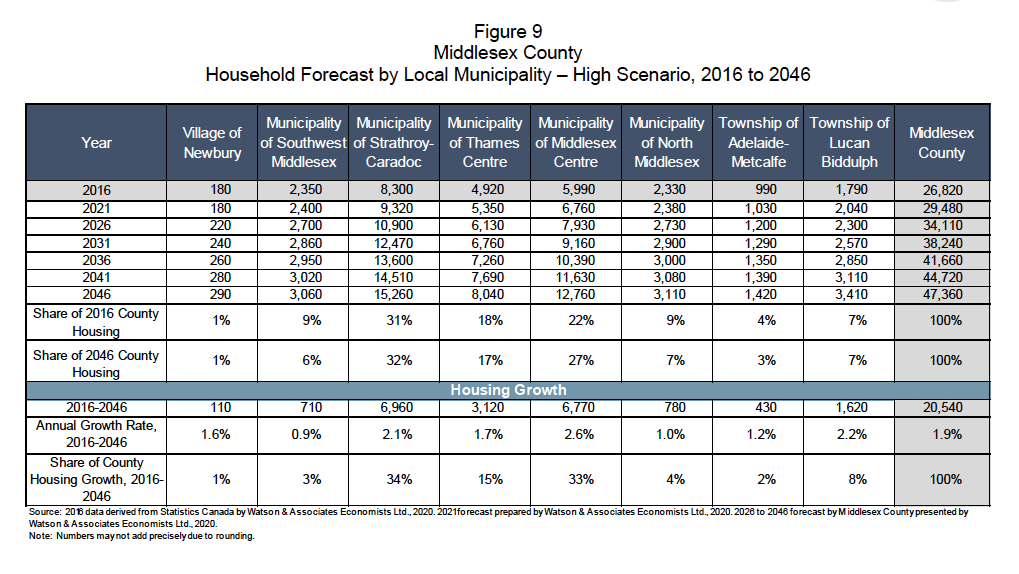
- Under the High Scenario, as shown below in Figure 9, the County’s population is forecast to increase to 115,000 by 2046, representing an annual growth rate of 1.5%. This would result in a housing growth rate of 1.9% annually.
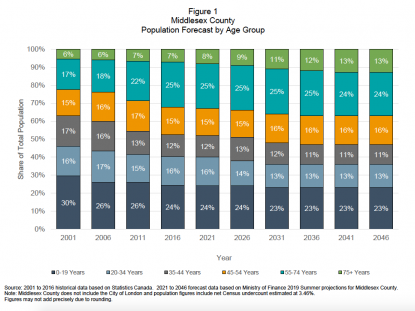
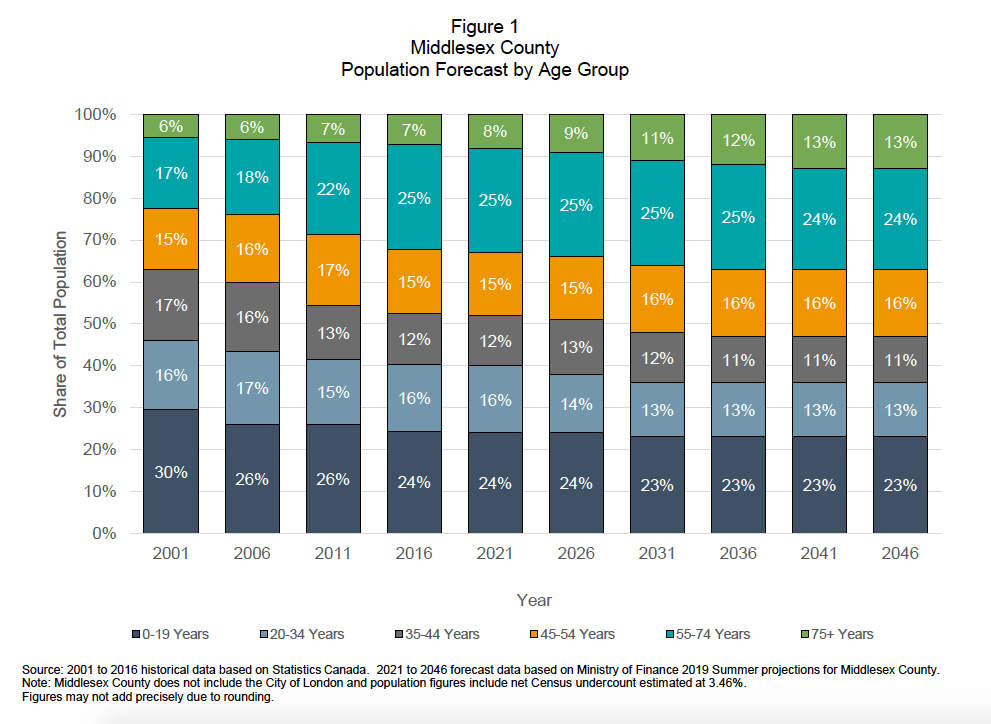
Future population growth (Figure 1), as well as associated housing needs, will largely be driven by seniors, Millennials (persons born between 1980 and 1992) and Generation Z (persons born between 1993 and 2005). The average age of the population in the County is getting older, similar to the Province as a whole. This is due to the large concentration of Baby Boomers (born 1946 to 1964) which represents approximately a quarter of the total population in Middlesex County. The percentage of seniors, particularly older seniors (aged 75+), is anticipated to steadily increase and is forecast to almost double, from 7% in 2016 to 13% by 2046. The Millennial generation, Generation Z, and the generations following Generation Z, are also significant as they represent the majority of the County’s existing and future labour force supply.
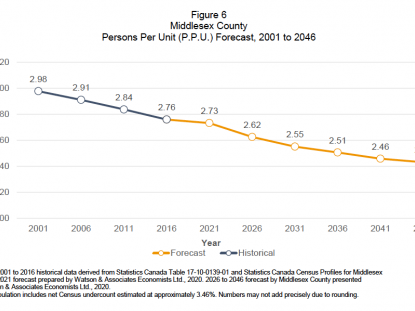
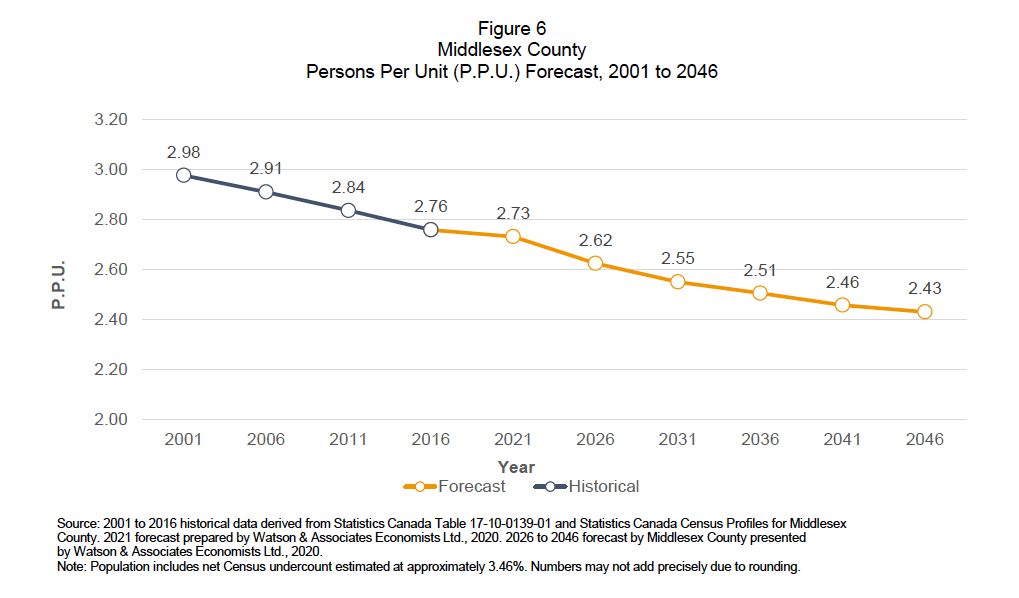
The ratio of total population divided by total households is referred to as the average number of persons per unit (P.P.U.). Figure 6 below summarizes historical and forecast P.P.U. trends for Middlesex County from 2001 to 2046. The average P.P.U. for the County has steadily declined, falling from 2.98 in 2001 to 2.76 in 2016. Over the long-term planning horizon, average P.P.U. levels for the County are forecast to continue to decline, from 2.75 in 2016 to 2.43 in 2046. This projected moderation in the County’s P.P.U. decline rate is largely a result of an anticipated increase in the number of young adults and children migrating to the County under all three Growth Scenarios, relative to the past two decades.
The Projected Population Range numbers take into account and reflect available Provincial numbers as well as the rapid development and growth that is occurring within Middlesex County. Population Projections are included within the County’s Official Plan and are used to help inform land use decisions and policies. The County Plan does not however constrain municipalities from realizing growth at a faster or slower rate than the projections. It is not the intention of the County Official Plan to limit well-planned housing and the Official Plan is flexible in this regard. Please see the full reports linked below.

